Conversion to Black and White
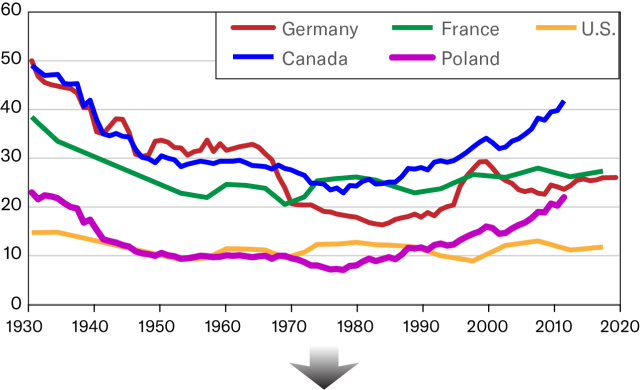
The simplest way to check figures’ accessibility is to convert them to black and white (alternatively, you can print the figures in black and white). Contrasting colors in the chart below may be indistinguishable for readers with color perception problems. Note that red, blue, green and purple appear almost identical when you convert them to black and white


Color and Tone
There are a number of ways to make your figures more accessible to
readers with color perception problems:
Rely on tonal (light vs dark) rather than on color contrast.
Low Accessibility:

High Accessibility:

Text Label Background
If possible, set black labels on light background and white labels on dark background.

Regarding Color Type
Avoid using color type, particularly yellow. Solid black is preferred.


Line Stroke
Use different stroke patterns for plot lines.

Scatter Plots
For scatter plots, consider using different shapes and/or outlines for different data points.
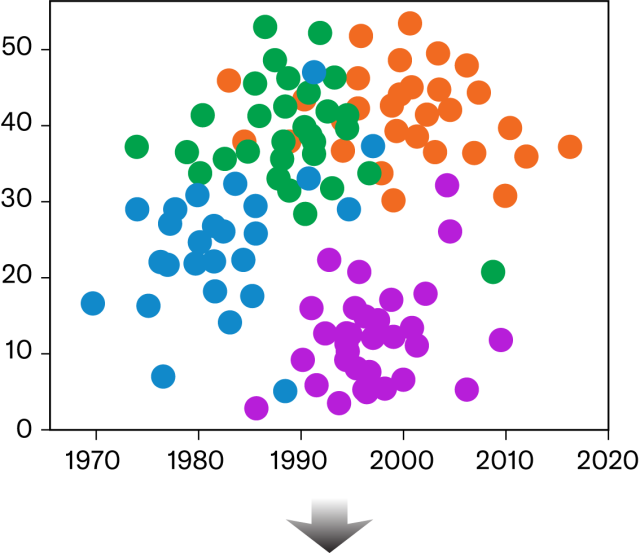
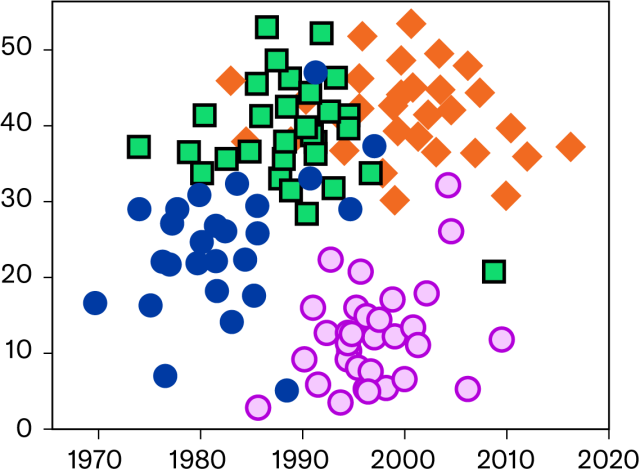
Chart Label Location
Label data directly, if possible, instead of using keys.
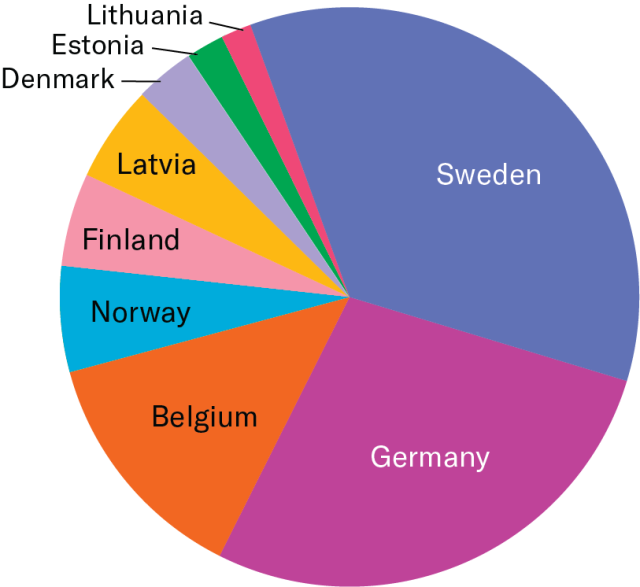
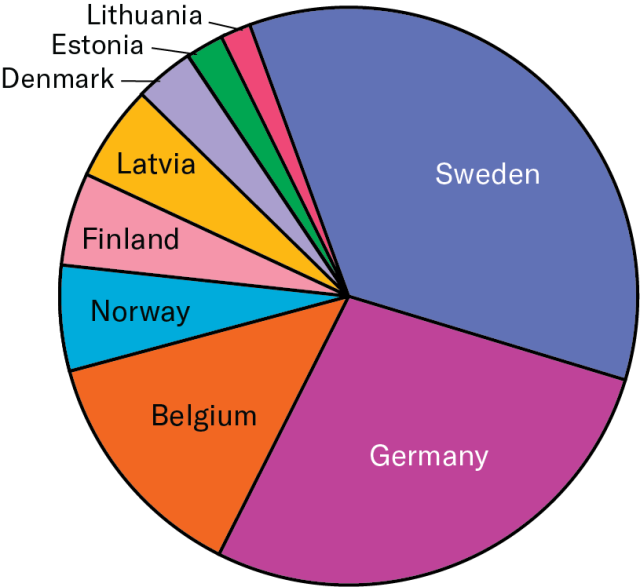
Pie Chart Outlines
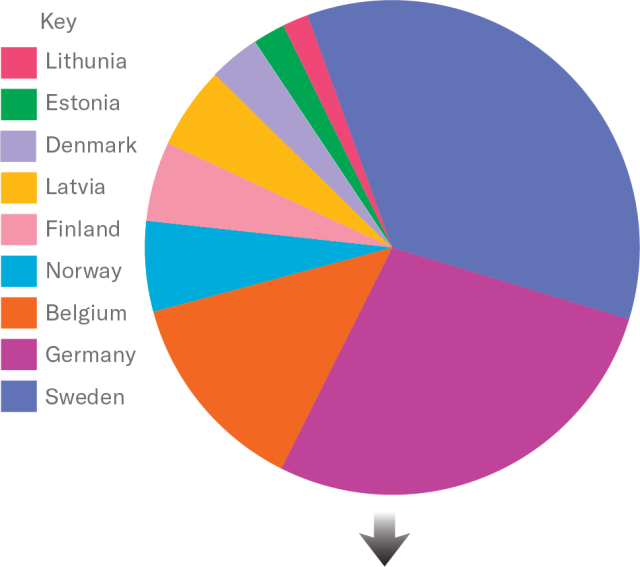
Use outlines, where feasible, for greater clarity between slices.
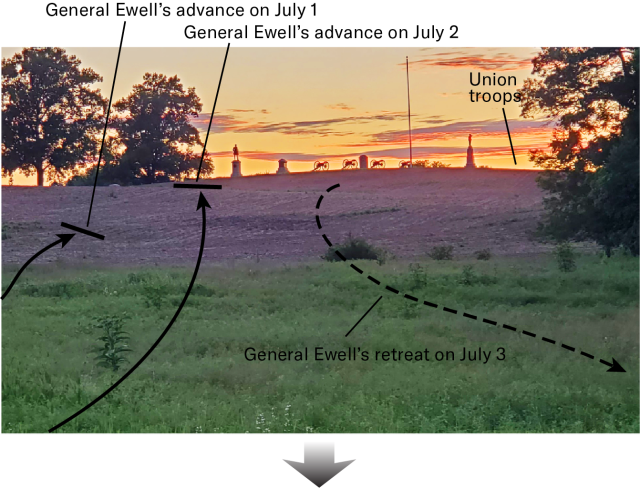
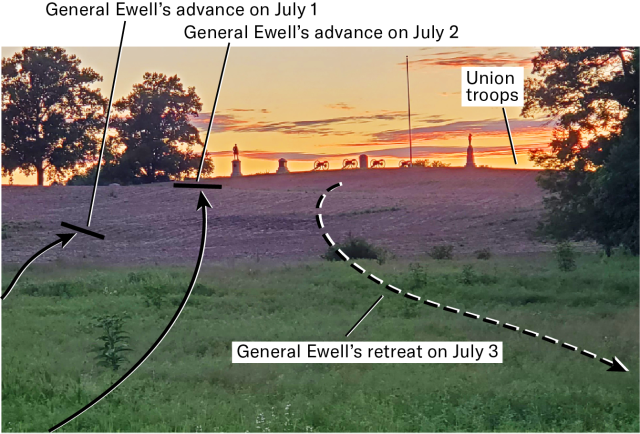
Offsetting with White
If the background is busy, consider offsetting your arrows, leader lines, and labels with white.
Lighting and Contrast
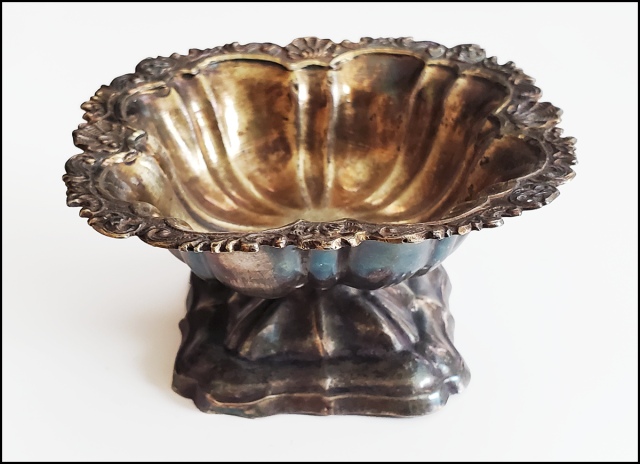
If you are taking photos to illustrate your book, please make sure there is sufficient lighting and background contrast.

Resources
- Color Oracle – Allows on screen preview of 3 types of color-blindness and grayscale for overall value contrast.
- Colour Contrast Analyzer – Can sample 2 colors from your screen to check their contrast with each other. Will also give pass/fail info. It provides color "recipes" in RGB.