Kieran Healy’s accessible primer, Data Visualization: A Practical Introduction explains what makes some graphs succeed while others fail, how to make high-quality figures from data using powerful and reproducible methods, and how to think about data visualization in an honest and effective way. Check out a few particularly successful examples from Healy.
Age Distribution of U.S. Representatives, 1945-2019
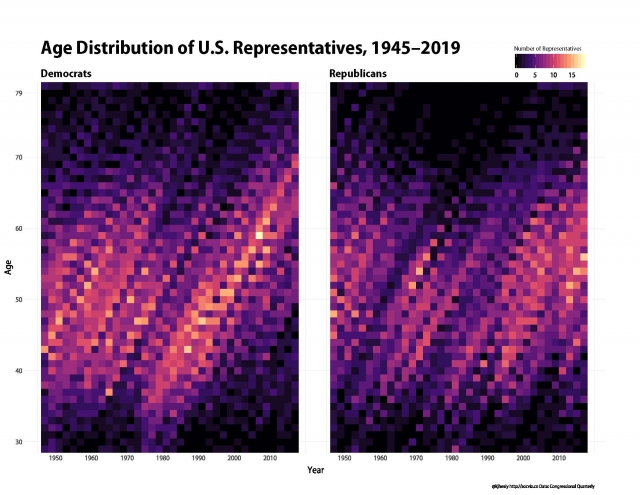
This is a “heatmap” of the ages of all U.S. House members, by party. Time runs from left to right, and age from bottom to top. The brighter the area, the more people there are of that age in that year. You can see, for example, the bright streak of Democrats elected in the early 1980s who have remained in the House since then.
Age distribution of U.S. Senators, 1945-2018
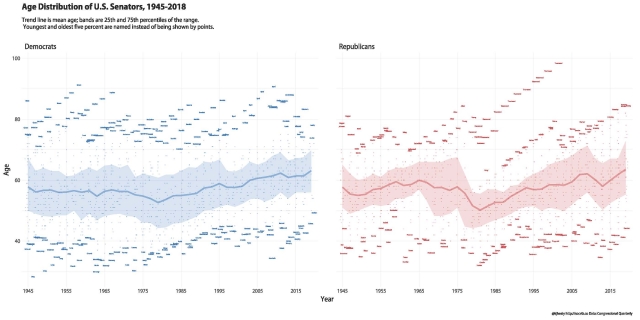
The panels show the average ages of all Democratic and Republican Senators, with the colored ribbons covering the range of the 25th to 7th percentiles. The oldest and youngest 5% of Senators are shown by name. You can see Robert Byrd and Strom Thurmond outliving everyone.
Men and Women in the House of Representatives
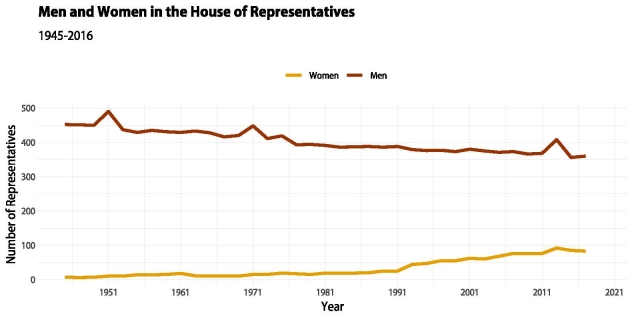
Every two years, some candidates are elected to Congress for the very first time. This is the “Freshman Class”. This chart shows the proportion of those first-timers who have been women. The incoming Democratic freshman class has a record number of women in it.
White Guys Named John vs African Americans in Congress
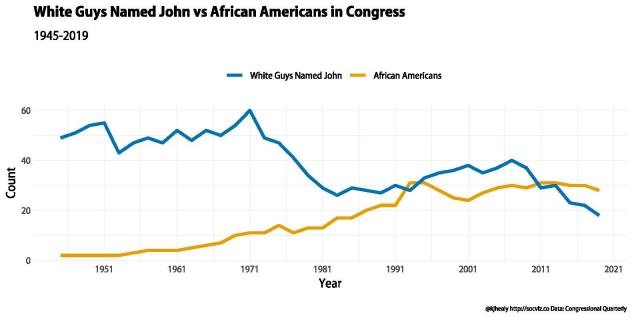
A slightly frivolous way to make a serious point. For most of the past seventy five years, there have been more white men named “John” in Congress than there have been African American representatives.
Mean Age of Congressional Members
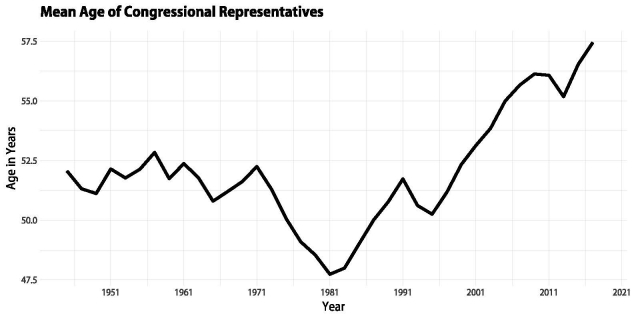
Congress has been getting older. Many of the young representatives elected in the late 1970s and early 1980s are still in the House.
Business & Law in the House of Representatives

When it comes to former occupations, Lawyers and Business people predominate in the House, but there are differences by party, and in addition the predominance of a legal background has declined over the decades.
Men and Women elected to Congress Winning Party by District
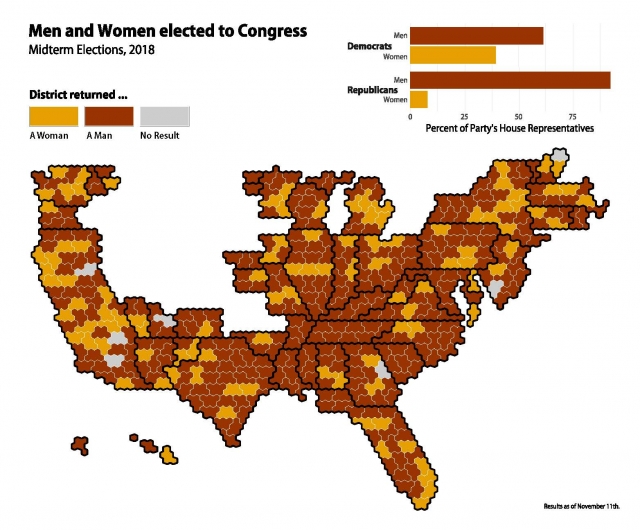
In this kind of map, called a cartogram, Congressional Districts are shown by shape. Districts are joined together to approximate the shape of the country while still representing the fact that more densely-populated regions have many more congressional districts than sparsely-populated ones.
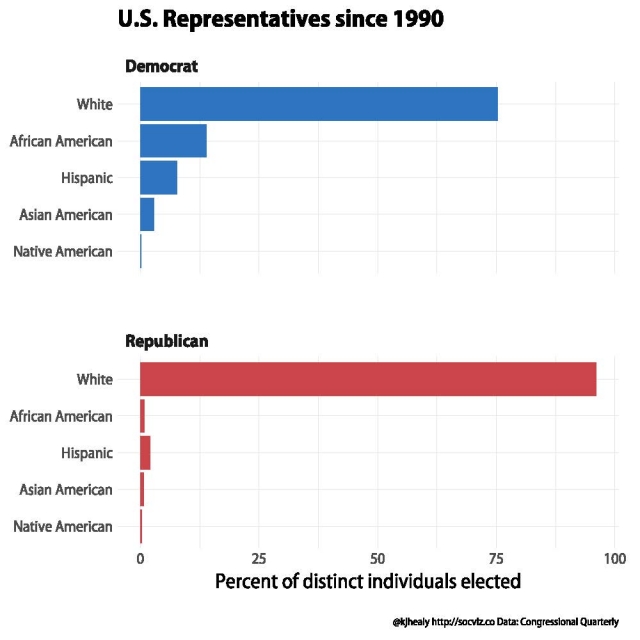
U.S. Representatives by Race