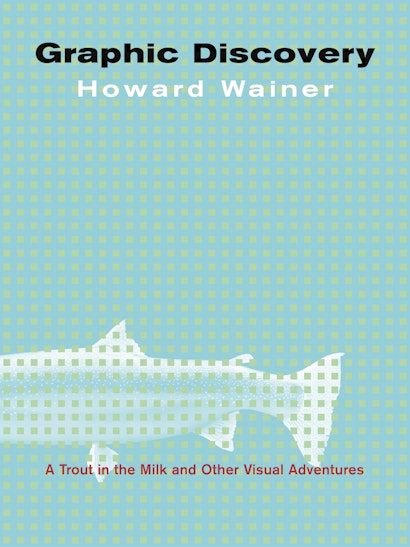
Good graphs make complex problems clear. From the weather forecast to the Dow Jones average, graphs are so ubiquitous today that it is hard to imagine a world without them. Yet they are a modern invention. This book is the first to comprehensively plot humankind’s fascinating efforts to visualize data, from a key seventeenth-century precursor—England’s plague-driven initiative to register vital statistics—right up to the latest advances. In a highly readable, richly illustrated story of invention and inventor that mixes science and politics, intrigue and scandal, revolution and shopping, Howard Wainer validates Thoreau’s observation that circumstantial evidence can be quite convincing, as when you find a trout in the milk.
The story really begins with the eighteenth-century origins of the art, logic, and methods of data display, which emerged, full-grown, in William Playfair’s landmark 1786 trade atlas of England and Wales. The remarkable Scot singlehandedly popularized the atheoretical plotting of data to reveal suggestive patterns—an achievement that foretold the graphic explosion of the nineteenth century, with atlases published across the observational sciences as the language of science moved from words to pictures.
Next come succinct chapters illustrating the uses and abuses of this marvelous invention more recently, from a murder trial in Connecticut to the Vietnam War’s effect on college admissions. Finally Wainer examines the great twentieth-century polymath John Wilder Tukey’s vision of future graphic displays and the resultant methods—methods poised to help us make sense of the torrent of data in our information-laden world.
Awards and Recognition
- One of Choice's Outstanding Academic Titles for 2005
"Well written and innovative. . . . The book is fascinating with its wide view, including introductions to historical personalities, analyses of statistical paradoxes, and well-documented discussions of actual uses of visual data to mislead viewers."—Choice
"During a dairyman's strike in 19th century New England, when there was suspicion of milk being watered down, Henry David Thoreau wrote, 'Sometimes circumstantial evidence can be quite convincing; like when you find a trout in the milk.' Howard Wainer uses this as a metaphor in his entertaining, informative, and persuasive book on graphs, or the visual communication of information. Sometimes a well-designed graph tells a very convincing story."—Raymond N. Greenwell, MAA Online
"Wainer's wit and broad intellect make this a very entertaining book."—Linda Pickle, American Statistician
"[A] personalized and readable jaunt through the history of charting."—The Economist
"This book may be seen as a chronology of graphic date presentation beginning with Playfair to the present and pointing toward the future. . . . It is a remarkable value that every practitioner of statistics can afford."—Malcolm James Ree, Personnel Psychology
"Graphic Discovery is a welcome addition to the literature on investigation and effective communication through graphic display. It contains a wealth of information and opinions, which are motivated and illustrated through a plethora of real life examples which can be easily incorporated into any educational setting: classroom, seminar, self-enhancement. . . . This book will be useful to and it can be mastered by a diverse readership."—Thomas E. Bradstreet, Computational Statistics
"The use of charts and graphs to make numbers both intelligible and memorable is a surprisingly modern idea. How this idea grew from a curiosity into a basic tool of modern science is a story of remarkable men and curious paradoxes, a story that Howard Wainer tells with zest and sympathetic understanding. Informative, readable, profoundly engaging."—George A. Miller, Princeton University, author of The Magical Number Seven, Plus or Minus Two
"I liked this book very much indeed. It will be very useful to the many who are interested in the interplay of forces that have yielded modern science."—Eric T. Bradlow, Wharton School of the University of Pennsylvania
"Fascinating. This book . . . the first to explore the chronological development of graphical data display . . . should be required reading for statisticians, applied researchers, scientists, and certainly for all journalists."—I. Elaine Allen, Babson College
"A delightful and thought-provoking book on statistical graphics. Wainer provides compact case studies of how graphical presentations such as bar charts, plots, and scattergrams can lead to important discoveries. The most compelling examples show how a published graphic could be dramatically improved to avoid misleading interpretations or make new discoveries. The most entertaining parts are his vignettes of historical figures, such as his twin heroes of William Playfair and John Tukey. I enjoyed Wainer's sardonic wit, personal anecdotes, and popular culture references, but the real gift was the clarity of thinking and the wise guidance about deep issues in statistics, data mining, and information visualization."—Ben Shneiderman, College Park, MD


